About these graphics
Paper counts come from Fischer, Otten, Lindsay, Miles and Streby (2025), who counted publications on 293 North American birds from 1965 to 2020 and found that research attention tracks how colourful and familiar a bird is. For the full analysis, read the paper or explore their data.
A note on representation
This infographic is a visual interpretation of research, not a reproduction of the original scientific analysis. It uses ten selected species from a dataset of 293 to explore how research attention influences what becomes visible and knowable.
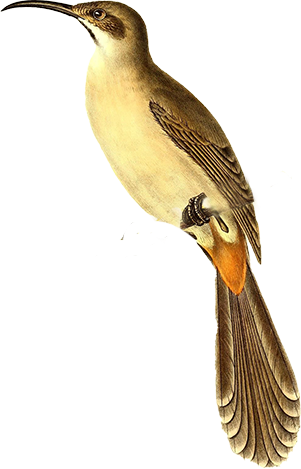
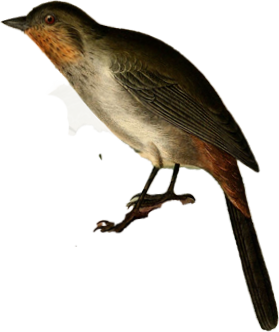
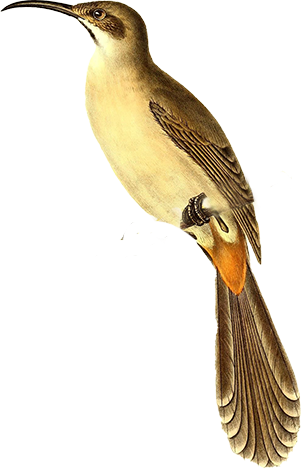
The comparisons between publication counts, breeding populations and physical size are intended to challenge assumptions about representation, not to suggest that any one of these measures should determine research priorities. A bird’s absence from the study’s publication record does not mean that it has never been observed, described or studied: the Crissal Thrasher was written about in the ornithological journal The Condor as early as 1902.
The final game takes this questioning further. Its scores are imagined and deliberately subjective, though informed by each bird’s natural history. By replacing one set of valued characteristics with another, it asks who decides what counts, how those decisions shape rankings, and what may be overlooked as a result.
The original research
Fischer, Otten, Lindsay, Miles and Streby (2025), “Six-decade research bias towards fancy and familiar bird species”, Proceedings of the Royal Society B 292: 20242846.
The sample. The study covers 293 songbirds and their near relatives whose breeding ranges lie entirely or mostly in the continental USA and Canada.
The period. It counts papers published over 56 years, from 1965 to 2020, as indexed by Web of Science. The authors read through the results by hand and kept only papers in which the bird was a main focus, so a passing mention does not count. The Tree Swallow tops the list with 597 papers; ten species, including the Crissal Thrasher, have none.
What it establishes. Three things go together with more research: a bird’s visual appeal, the size of its breeding range, and the number of universities within that range. Together they account for nearly half the variation in research between species. Of the seven features in the aesthetic score, only colour and pattern made a difference. The study shows that these traits and research attention go together; it does not set out to explain every bird’s neglect, or to rank birds by worth.
How the birds were represented
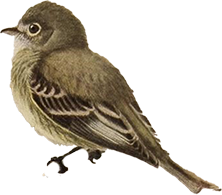
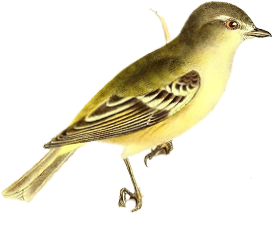
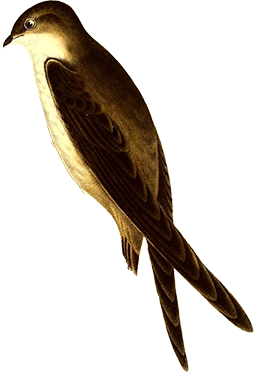
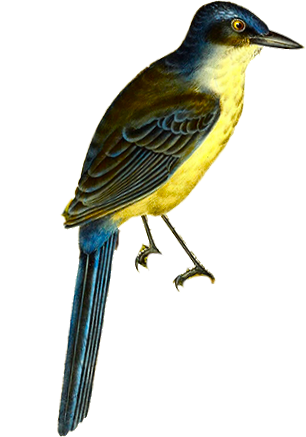
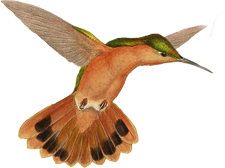
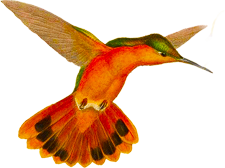
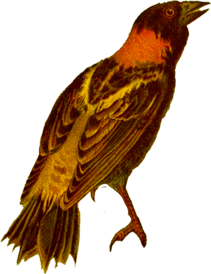
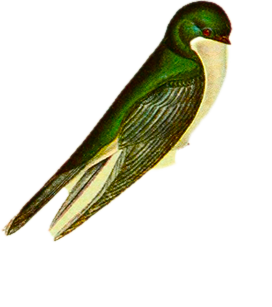
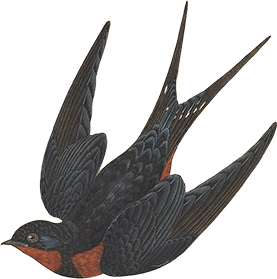
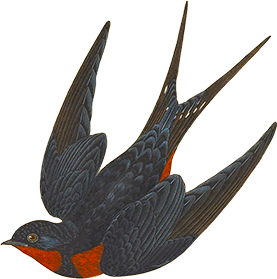
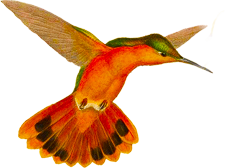
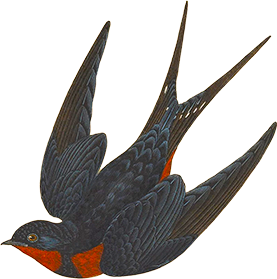
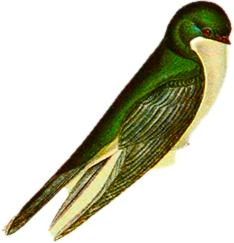
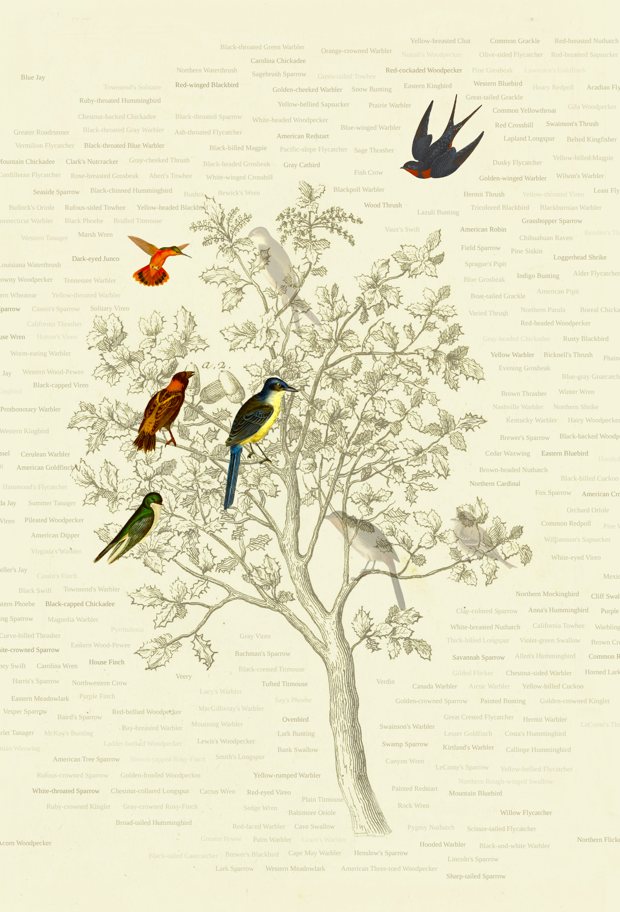
Fading. In the opening tree, each bird and name fades according to its paper count, on a logarithmic scale, so the gap between no papers and four shows as clearly as the gap between 100 and 597. Birds with no papers vanish completely. The five featured birds with 100 or more papers stay at full strength. The Rufous Hummingbird and Barn Swallow grow brighter as you scroll, a colour boost carried over from the original artwork as a nod to the paper’s point that attention compounds; it is not a data value.
Painted area. In the resizing rows, each bird’s painted area is proportional to its share of papers or of population, measured from the painted pixels so that birds in different poses are compared fairly. Both rows share out the same total area, like one budget of attention divided two ways.
Population. Population figures are breeding estimates for the USA and Canada from the Partners in Flight Population Estimates Database (version 3.0, 2019). Papers are a 56-year total and populations a snapshot from about 2006 to 2015, so the comparison is illustrative. The Scrub-Jay population combines four species that were grouped together in the original study. For the Crissal Thrasher, the USA and Canada estimate is about 82,000; the global estimate, including Mexico, is about 110,000.
Body length. Lengths are from the Cornell Lab of Ornithology’s All About Birds identification pages; the Scrub-Jay uses the Woodhouse’s and California Scrub-Jay range. Each bird’s painted area is proportional to the square of its length. Because every bird is resized until its area matches, the size it was originally painted at cancels out. Pose does not: birds drawn with wings or tail spread, like the Rufous Hummingbird and Barn Swallow, spend some of their area on feathers, so their bodies come out slightly small.
Aesthetic scores. The scores and ranks in the first scorecards are the study’s, made from the illustrations in the Sibley Birds app. Playing them as rounds of a card game, with a star for each winner, is ours: the study simply adds the points.
Contrasting ways of seeing. Papers, population and body size are not competing measures of a bird’s importance. Each is a different way of looking at the same ten birds, and each changes which of them fills the frame.
Geography, proximity and limitations
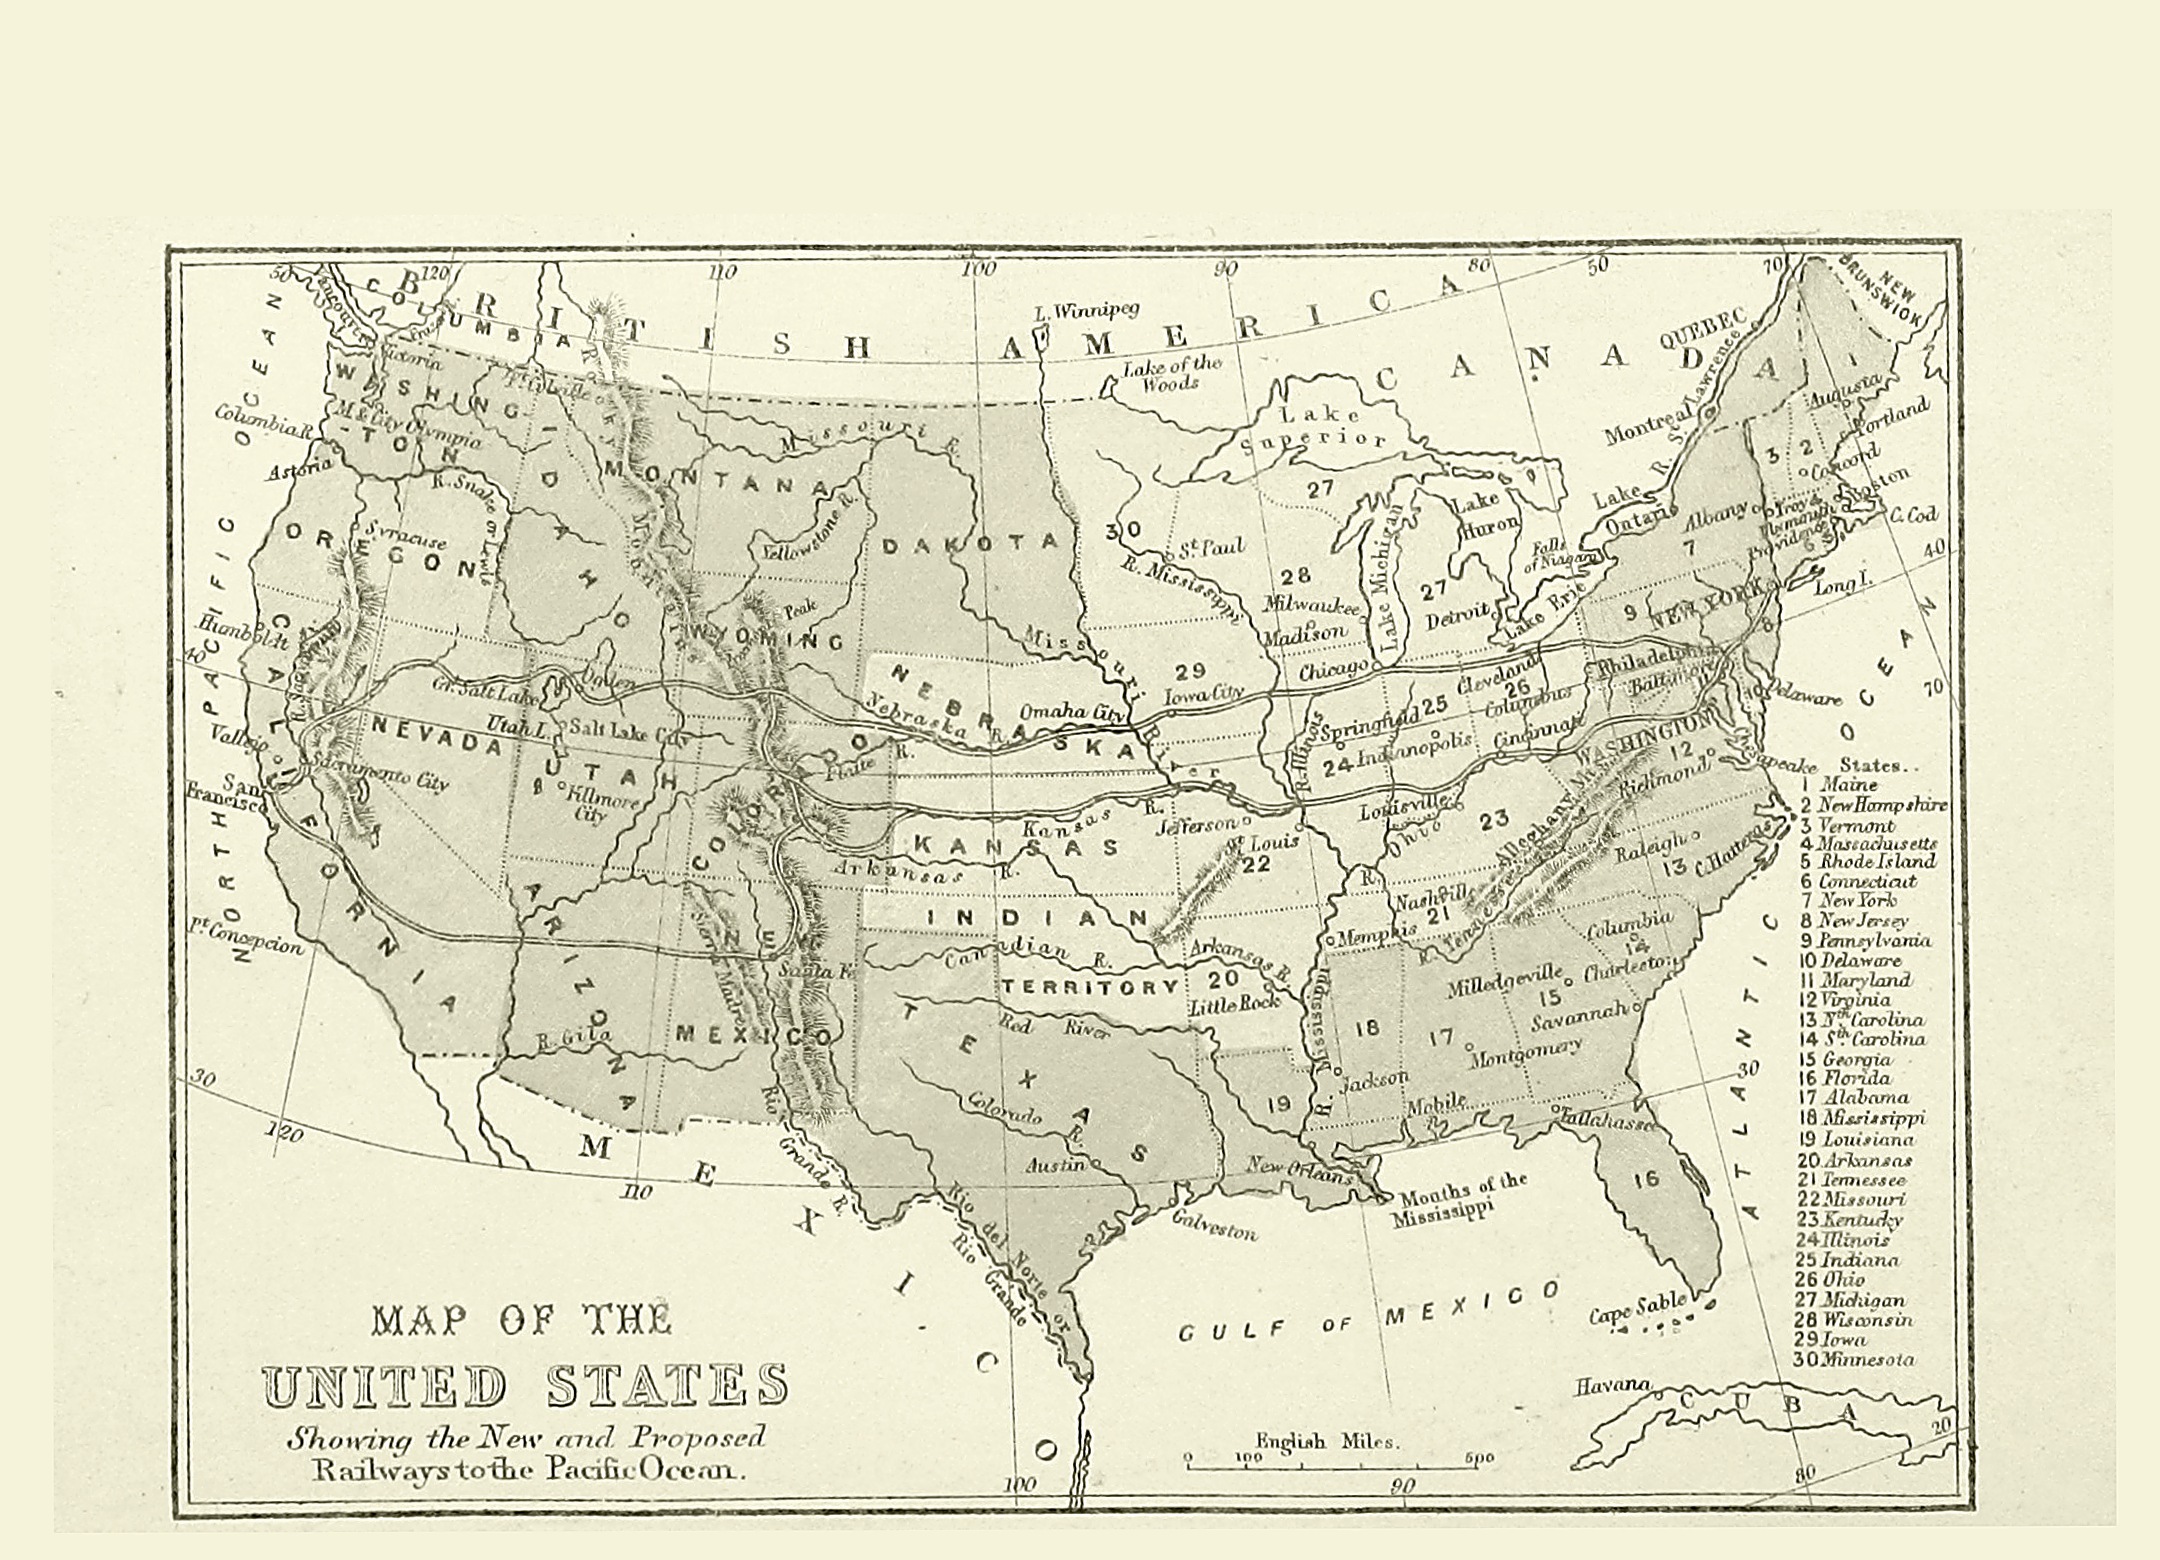
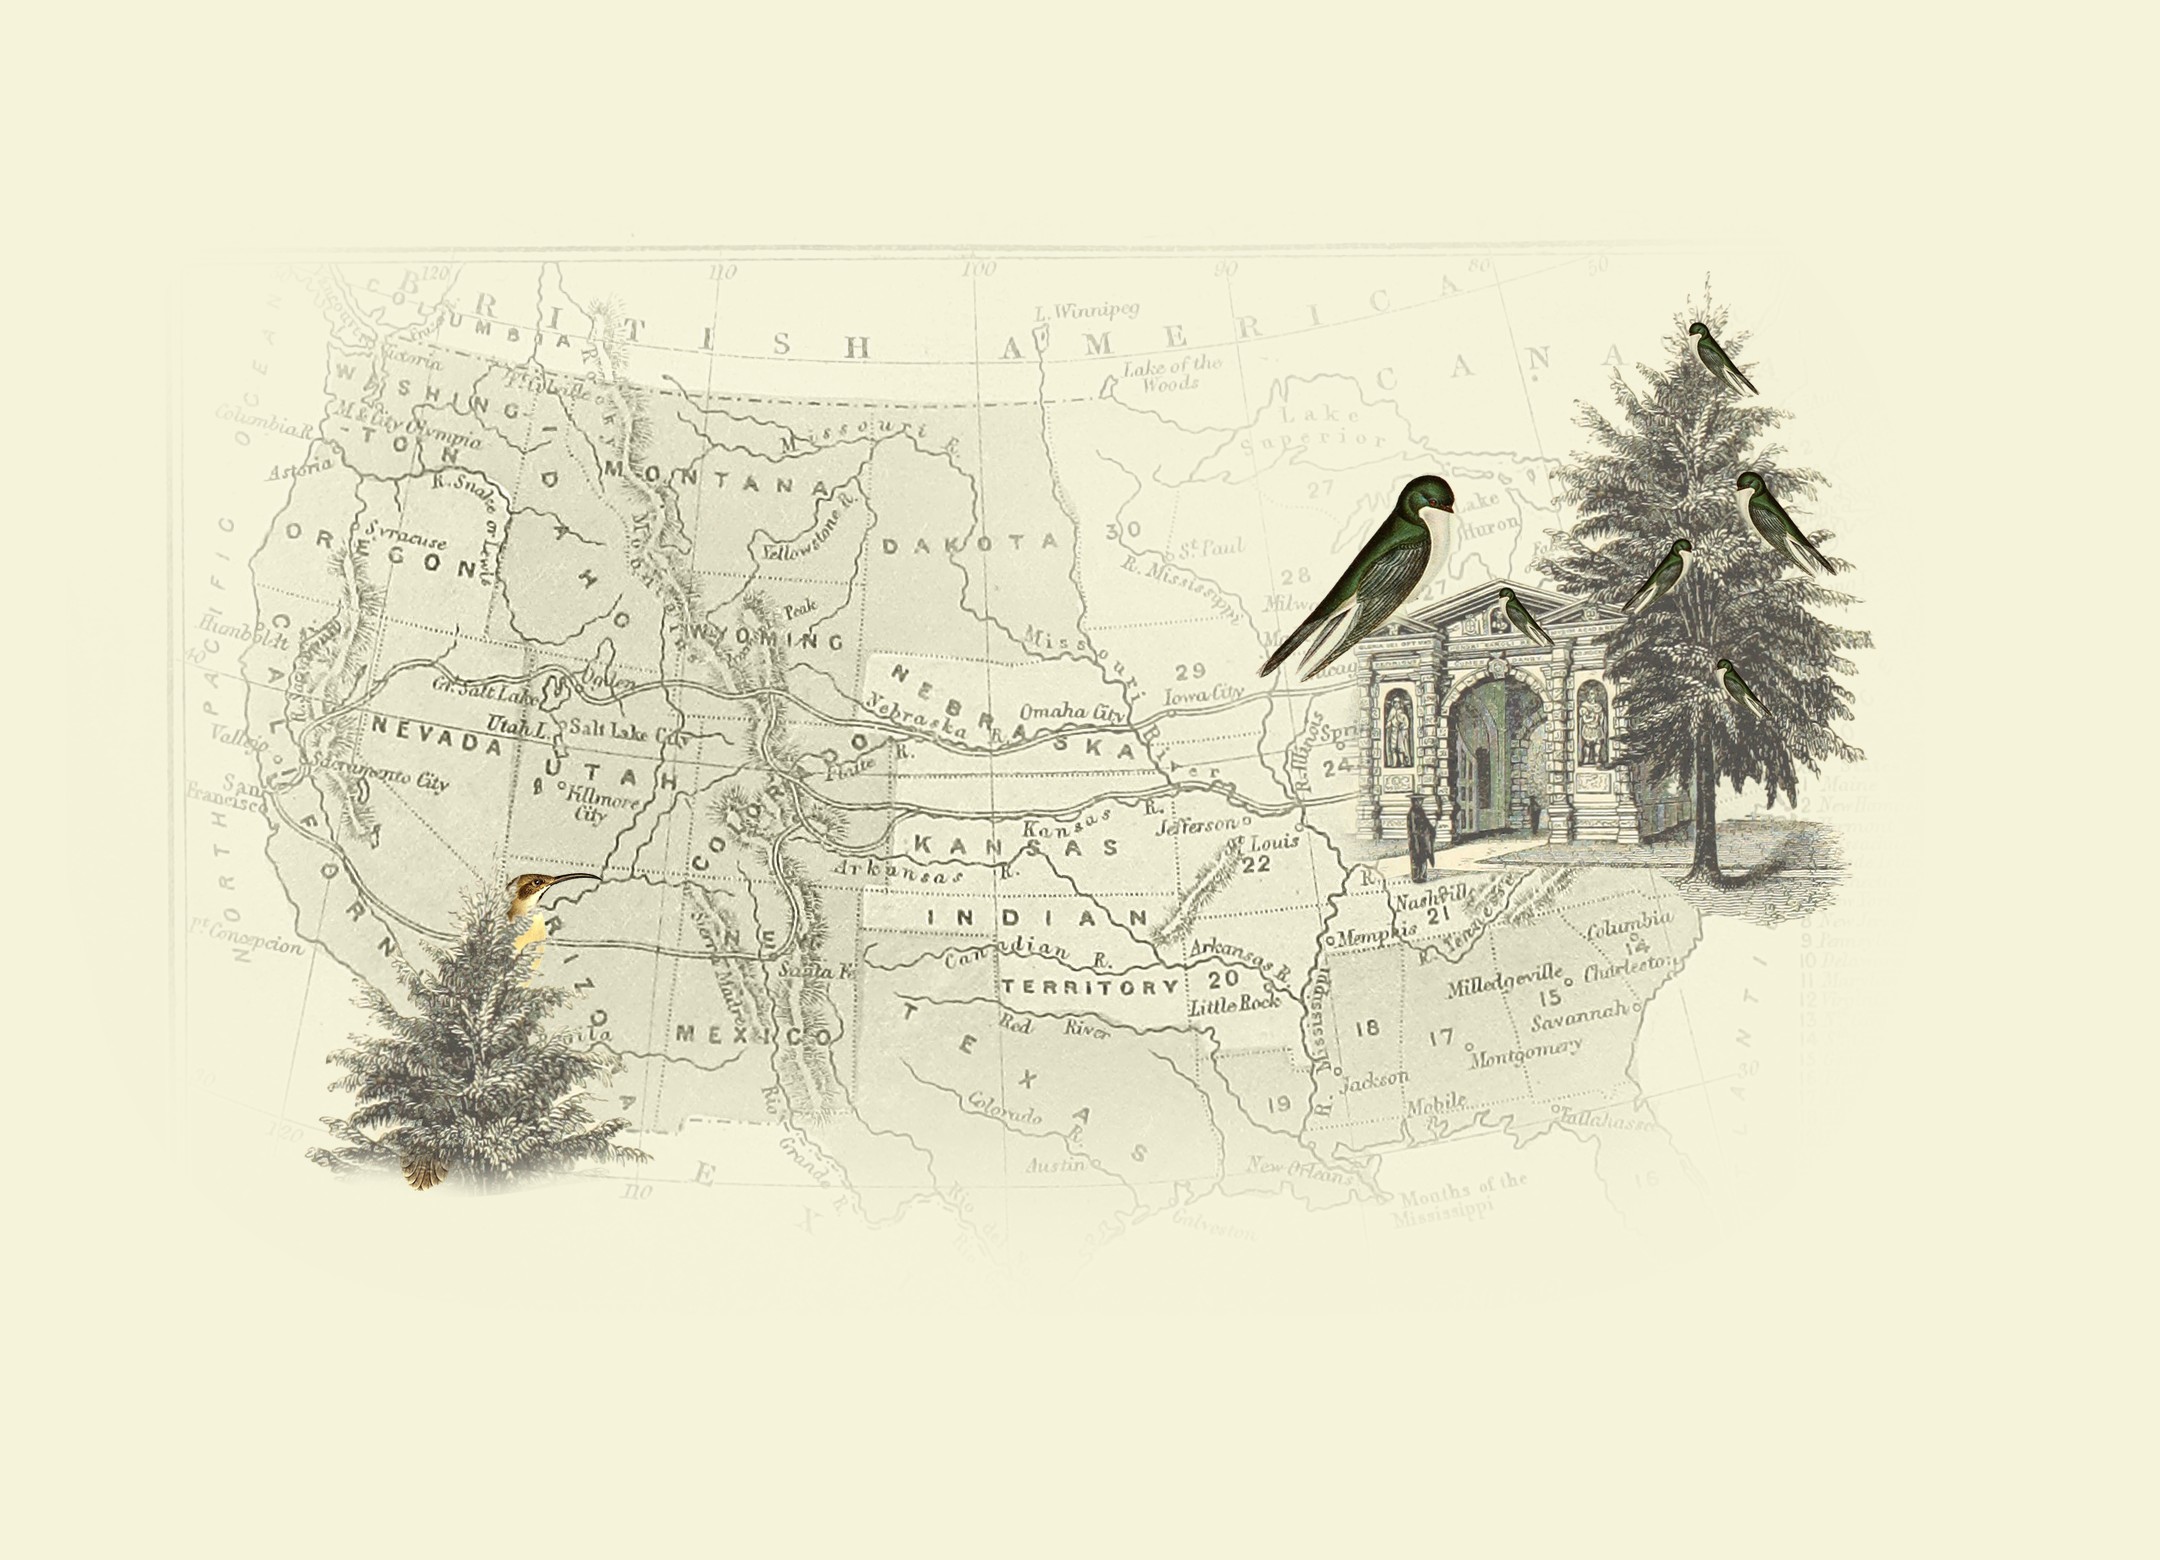
Breeding ranges. Range size is one of the study’s three measures, calculated from BirdLife International range maps. On our map the ranges are approximate and drawn by hand, after the Cornell Lab of Ornithology, on an 1860s Map of the United States, showing the New and Proposed Railways to the Pacific Ocean. Each little bird stands for about 41,000 breeding birds, from the Partners in Flight estimates: two Crissal Thrashers and 463 Tree Swallows, spread evenly across each range, so their positions are not real locations. The Tree Swallow’s southern breeding limit follows the American Ornithologists’ Union checklist (southern California, central Nevada, central Arizona, south-central New Mexico, north-eastern Louisiana, Tennessee and North Carolina).
The edges of the map. Most of the Tree Swallow’s range, and most of its birds, lie in Canada beyond the top of the map, so the northernmost are drawn paler. The Crissal Thrasher’s range continues south into Mexico, beyond the map’s edge.
Universities. The counts of 21 and 1,414 are the study’s: the number of four-year colleges and universities inside each bird’s breeding range. Only institutions in the USA and Canada were counted, so the Thrasher’s range in Mexico adds none. The collage is imagined. The study counted universities within each range rather than measuring distance, so the dotted line between the desert shrub and the university gate is a gesture, not a measurement.
Association, not causation. The study shows that small ranges, few nearby universities and drab plumage go together with little research. It does not show that any one of them caused a particular bird’s neglect, and the authors note that other things they did not measure, such as behaviour, song or migration, may also play a part. That is why this section asks what might explain the Crissal Thrasher’s absence.
The imagined scoring system
Why it exists. The game is deliberately subjective. Its purpose is to expose how selecting attributes constructs a ranking, not to produce another scientific measure. Change what you count, and the order of the birds changes with it.
Where the values came from. The seven values were suggested by the Cornell Lab’s pages on the Crissal Thrasher, which describe one of the finest desert songsters: a bird that forages on the ground with its long, curved bill, runs rather than flies, and holds its territory as a pair all year. Choosing them from the Thrasher’s own natural history tilts the game in its favour, and that is part of the point: the original aesthetic score was also built from a particular way of looking.
How the birds were scored. Each bird is scored from 1 to 10 on each value. The scores are judgement calls, checked against each bird’s natural history on the Cornell Lab’s life-history pages. Song scores follow what listeners find most pleasant in birdsong: complex songs with varied notes and trills score highest, simple, loud ones lowest, from a 2026 study of European birds used here as a guide rather than a score.
How the game plays. The cards are shuffled at random. When the other hand chooses, it plays its card’s highest value. Each card shows the bird’s real number of research papers, so the ghosted birds can be seen winning.
Sources, data and image credits
The figures for the ten birds.
| Bird | Research papers | Population | Length |
|---|
| Philadelphia Vireo | 0 | 4 million | 11–12 cm |
|---|
| Crissal Thrasher | 0 | 82,000 | 30 cm |
|---|
| White-throated Swift | 1 | 2.4 million | 15–18 cm |
|---|
| Canyon Towhee | 3 | 2.8 million | 21–25 cm |
|---|
| Gray Flycatcher | 4 | 2.9 million | 14–15 cm |
|---|
| Bobolink | 100 | 10 million | 15–21 cm |
|---|
| Rufous Hummingbird | 112 | 22 million | 7–9 cm |
|---|
| Barn Swallow | 123 | 47 million | 15–19 cm |
|---|
| Scrub-Jay | 224 | ~2 million | 28–30 cm |
|---|
| Tree Swallow | 597 | 19 million | 12–15 cm |
|---|
Research. Fischer, S. E., Otten, J. G., Lindsay, A. M., Miles, D. and Streby, H. M. (2025). Proceedings of the Royal Society B 292: 20242846. Data on Dryad.
Population. Partners in Flight Population Estimates Database, version 3.0 (2019).
Natural history and body length. Cornell Lab of Ornithology, All About Birds: Crissal Thrasher, Tree Swallow, California Scrub-Jay, Barn Swallow, Rufous Hummingbird, Bobolink, Gray Flycatcher, Canyon Towhee, White-throated Swift and Philadelphia Vireo.
Birdsong. A 2026 study in Frontiers in Bird Science of the songs listeners find most pleasant, reported by Audubon.
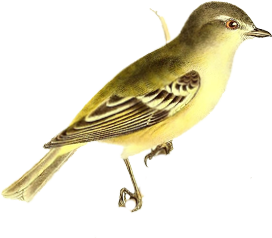
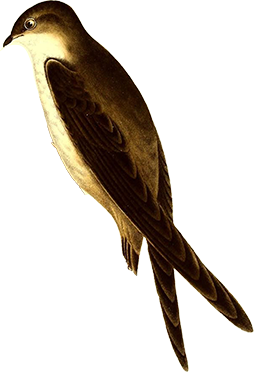
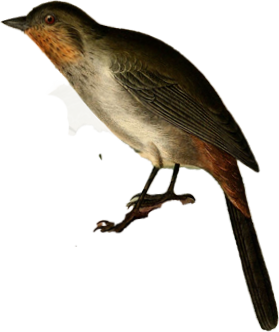
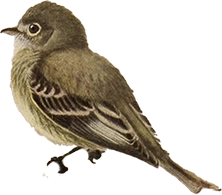
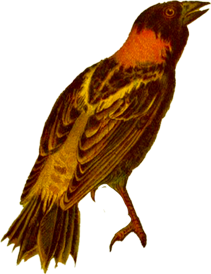
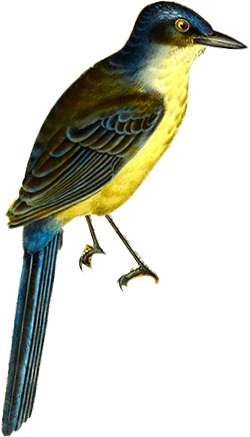
Images. Bird illustrations are public-domain plates from the Biodiversity Heritage Library. The tree is Ilex aculeata, Plate 117. The range maps use an 1860s Map of the United States, showing the New and Proposed Railways to the Pacific Ocean. Collages by Sarah-Jane Crowson.
Attribution. Concept, research, visual design and creative direction by Sarah-Jane Crowson. Developed in critical dialogue with ChatGPT (OpenAI), with technical implementation supported by Claude (Anthropic). Further details in the [GitHub README](https://github.com/sjfc/birdwatching_ghosts#readme).